


How Cities Can Identify Chronically Under-Served Streets and Neighborhoods Using Data
- umangvindheshwari
- 30 minutes ago
- 7 min read

A city may report high overall door-to-door waste collection coverage and still leave some streets waiting. One colony may see collection every morning, while a nearby basti gets missed twice a week. A peripheral layout may be marked as covered in ward records, but the vehicle may never enter the last three lanes. City-wide averages can hide these gaps.
For municipal teams, this is a serious service issue. Missed collection leads to waste accumulation, open dumping, citizen complaints, and loss of trust. The challenge is that these gaps are often invisible until residents complain repeatedly. By then, the problem has already become chronic.
The better approach is to use data to identify under-served streets and neighbourhoods early, before service failure becomes routine.

Why some areas remain under-served
Chronically under-served areas rarely happen because of one isolated mistake. They usually result from repeated small gaps in planning, monitoring, and follow-up.
Common causes include:
Incomplete or inefficient collection routes
Routes may not include newly developed streets, informal settlements, or recently occupied housing layouts.
Vehicles skipping specific streets repeatedly
Narrow lanes, parked vehicles, poor road access, or time pressure can lead crews to bypass the same locations again and again.
Limited visibility into actual route coverage
A vehicle may leave the depot and complete part of the route, but manual reporting may still mark the full route as completed.
Uneven deployment of workers and vehicles
Some wards grow faster than others, but staff and vehicle allocation may remain based on older estimates.
Rapid urban expansion
Peripheral colonies, mixed-use layouts, and slum pockets can expand faster than official service maps are updated.
Weak complaint tracking and follow-up
Complaints may be closed after one visit without checking whether the issue repeats.
Dependence on manual registers
Paper records can show attendance and vehicle dispatch, but they cannot reliably prove street-level coverage.
Lack of ward-level and street-level performance data
Without localised data, administrators see the city as a single unit rather than a set of service areas with different needs.
The result is a familiar pattern. Some neighbourhoods receive dependable daily service. Others remain dependent on escalation, personal follow-up, or citizen pressure.
Data helps cities move from complaint-led to evidence-led monitoring
Waiting for complaints puts the burden on residents. It also favours areas where citizens are more aware, connected, or vocal. Lower-income settlements, migrant communities, and peripheral habitations may complain less, even when service gaps are severe.
A data-led system changes the starting point. It allows municipalities to ask practical questions every day:
Which streets were actually covered?
Which points were missed more than once this week?
Which wards show lower collection frequency?
Which vehicle routes regularly deviate from the approved plan?
Which complaints are linked to repeated non-service?
This is the core value of How Cities Can Identify Chronically Under-Served Streets and Neighborhoods Using Data as an operating approach. The aim is not only to measure performance, but to find blind spots and correct them quickly.
GPS route history shows where vehicles actually travelled
GPS-based tracking is one of the most useful tools for identifying missed areas. It records the movement of waste collection vehicles during their daily routes. Over time, this creates a route history that can be reviewed at street and ward level.
This helps answer three basic questions:
Did the vehicle enter the assigned area?
Did it cover the full route or only part of it?
Did it spend enough time in the area to complete collection?
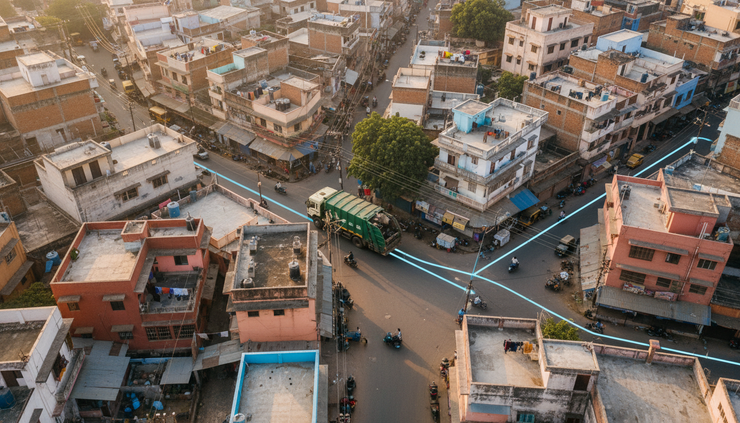
For example, a ward route may show that a vehicle consistently covers the main road but avoids two internal lanes. On paper, the ward looks serviced. On the map, the gap becomes clear.
GPS history is also useful for checking whether service interruptions are one-time events or recurring patterns. A single missed lane may be due to a roadblock. The same lane missed every three days points to a deeper route or deployment issue.
Planned routes must be compared with actual coverage
Many cities have route plans, but the real question is whether vehicles follow them. A planned route is useful only when it can be compared with actual field movement.
This comparison can show:
Streets included in the plan but not covered
Streets covered in the wrong sequence
Areas where vehicles turn back before completing the route
Routes that take too long because they are poorly designed
Locations where vehicles repeatedly stop short of the assigned endpoint
Route comparison also helps supervisors avoid guesswork. Instead of asking whether a team “completed the route”, they can review the actual movement against the approved map.
This is especially valuable in dense wards where one vehicle may serve several colonies, markets, and interior lanes. A missed pocket may not be visible from the main road, but it will show up when planned and actual routes are compared.
Missed collection points should be tracked over time
A missed collection point is not always a service failure. Road repair, vehicle breakdown, heavy rain, or local obstruction can disrupt collection on a given day.
The concern begins when the same point is missed repeatedly.
Municipalities can identify chronic gaps by tracking:
Data point | What it reveals |
Missed streets by date | Whether the issue is isolated or repeated |
Missed points by vehicle | Whether a specific route team needs support |
Missed points by ward | Whether the problem is localised |
Missed points by time of day | Whether scheduling causes the gap |
Repeat misses over 7, 15, or 30 days | Whether the area is chronically under-served |
This type of monitoring helps sanitation officers distinguish between operational noise and real service patterns.
Ward-wise and neighbourhood-wise analysis makes gaps visible
City-level coverage is too broad for daily sanitation management. A city may report strong overall performance while one ward, zone, or pocket remains weak.
Ward-wise and neighbourhood-wise analysis brings the problem closer to the ground. It can show which areas have:
Lower collection frequency
More missed points
Higher complaint density
More route deviations
Longer delays after complaints
Poorer vehicle availability
This is useful for fair resource allocation. If one ward has grown rapidly, it may need an extra vehicle, route redesign, or more workers. If another ward has high vehicle movement but low street coverage, the issue may be route discipline or supervision.
Localised performance data also improves review meetings. Instead of discussing only total trips or total waste collected, teams can review whether each neighbourhood received reliable service.

Complaint trends can confirm hidden service gaps
Citizen complaints are not the only source of truth, but they are still valuable. When complaint data is mapped and analysed, it can reveal clusters of repeated non-collection.
Municipal teams should look for:
Multiple complaints from the same street
Similar complaints from nearby lanes
Complaints reopening after being marked resolved
Delayed resolution in specific wards
Seasonal patterns, such as monsoon-related access issues
Frequent complaints from newly developed layouts
The key is to connect complaints with route and vehicle data. If residents from one colony complain every week and GPS records show irregular vehicle entry, the cause becomes clearer. If complaints continue even when GPS shows vehicle movement, supervisors may need to check collection quality, timing, or staff behaviour.
Good complaint analysis also prevents false closure. A complaint should not be treated as resolved only because a vehicle visited once. The system should check whether service remains consistent afterwards.
Dashboards and alerts help supervisors act faster
Data becomes useful when it reaches the right person in a clear format. Dashboards can help commissioners, health officers, ward supervisors, and Smart City teams monitor performance without reading multiple registers.
A useful sanitation dashboard should highlight:
Low-performing wards
Routes with repeated deviations
Streets missed more than once
Vehicles with incomplete route coverage
Areas with rising complaints
Collection frequency by neighbourhood
Delayed complaint resolution
Service gaps over time
Alerts add another layer of control. For example, the system can flag a street if it has been missed twice in a week or if a vehicle deviates from its route for several days. This allows supervisors to intervene before the area becomes chronically under-served.
The goal is not to punish field teams. The goal is to find constraints early, such as unrealistic routes, vehicle shortages, access barriers, or staff gaps.
Historical data reveals patterns that daily reports miss
Daily monitoring helps with immediate correction. Historical data helps with planning.
By reviewing data across weeks and months, municipalities can identify patterns such as:
Wards that regularly underperform on certain days
Routes that fail during peak traffic hours
Areas affected by market waste or festival waste
New colonies that need formal inclusion in routes
Locations where vehicle capacity is not enough
Streets that need smaller vehicles due to access limits
This evidence supports better route redesign, budget planning, staff deployment, and contractor review. It also helps cities prepare for growth instead of reacting after service complaints increase.

How SafaiMitra fits into data-led sanitation monitoring
SafaiMitra supports municipalities by bringing field data, vehicle movement, route visibility, and service monitoring into one digital system. It helps teams move beyond manual registers and delayed reports.
With a platform like SafaiMitra, cities can:
Track GPS-based vehicle movement
Compare planned routes with actual coverage
Monitor ward-wise and neighbourhood-wise collection
Identify repeated missed points
Review complaint trends with service data
Create alerts for recurring gaps
Use dashboards for daily and monthly reviews
Build historical records for planning and audits
The value lies in making service gaps visible. Once a street or colony is clearly identified as under-served, the municipality can redesign the route, adjust vehicle deployment, assign support staff, or improve follow-up.
What success looks like
A well-managed sanitation system should not depend only on complaints to find missed areas. It should know which streets were covered, which were not, and which locations need attention tomorrow.
For Indian cities, the next step is to treat collection coverage as a street-level service metric, not just a city-level percentage. GPS history, route comparison, complaint trends, dashboards, alerts, and historical analysis can help ULBs find chronic gaps before they become public health and governance problems.
When cities use data well, under-served neighbourhoods are no longer hidden in averages. They become visible, measurable, and correctable.
Comments